Netdata is a high-performance, cloud-native, and on-premises observability platform designed to monitor metrics and logs with unparalleled efficiency. It delivers a simpler, faster, and significantly easier approach to real-time, low-latency monitoring for systems, containers, and applications.
What sets Netdata apart is its cost-efficient, distributed design. Unlike traditional monitoring solutions that centralize data, Netdata distributes the code. Instead of funneling all data into a few central databases, Netdata processes data at the edge, keeping it close to the source. The smart open-source Netdata Agent acts as a distributed database, enabling the construction of complex observability pipelines with modular, Lego-like simplicity.
Netdata also incorporates A.I. insights for all monitored data, training machine learning models directly at the edge. This allows for fully automated and unsupervised anomaly detection, and with the provided APIs and UIs, users can quickly spot correlations and gain deeper insights.
The Netdata Ecosystem
Netdata is built on three core components:
Netdata Agent (usually called just «Netdata»): This open-source component is the heart of the Netdata ecosystem, handling data collection, storage (embedded database), querying, machine learning, exporting, and alerting of observability data. All observability data and features a Netdata ecosystem offers, are managed by the Netdata Agent. It runs in physical and virtual servers, cloud environments, Kubernetes clusters, and edge/IoT devices and is carefully optimized to be a polite citizen for production systems and applications.
Netdata Cloud: Enhancing the Netdata Agent, Netdata Cloud offers enterprise features such as user management, role-based access control, horizontal scalability, alert and notification management, access from anywhere, and more. Netdata Cloud does not centralize or store observability data.
Netdata Cloud is a commercial product, available as an on-premises installation, or a SaaS solution, with a free community tier.
Netdata UI: The user interface that powers all dashboards, data visualization, and configuration.
While closed-source, it is free to use with both Netdata Agents and Netdata Cloud, via their public APIs. It is included in the binary packages offered by Netdata and its latest version is publicly available via a CDN.
Netdata scales effortlessly from a single server to thousands, even in complex, multi-cloud or hybrid environments, with the ability to retain data for years.
Key characteristics of the Netdata Agent
💥 Collects data from 800+ integrations
Operating system metrics, container metrics, virtual machines, hardware sensors, applications metrics, OpenMetrics exporters, StatsD, and logs. OpenTelemetry is on its way to be included (currently being developed)…
💪 Real-Time, Low-Latency, High-Resolution
All data are collected per second and are made available on the APIs for visualization, immediately after data collection (1-second latency, data collection to visualization).
😶🌫️ AI across the board
Trains multiple Machine-Learning (ML) models at the edge, for each metric collected and uses AI to detect anomalies based on the past behavior of each metric.
📜 systemd-journald Logs
Includes tools to efficiently convert plain text log (text, csv, logfmt, json) files to structured systemd-journald entries (log2journal, systemd-cat-native) and queries systemd-journal files directly enabling powerful logs visualization dashboards. The Netdata Agents eliminate the need to centralize logs and provide all the functions to work with logs directly at the edge.
⭐ Lego like, Observability Pipelines
Netdata Agents can be linked to together (in parent-child relationships), to build observability centralization points within your infrastructure, allowing you to control data replication and retention at multiple levels.
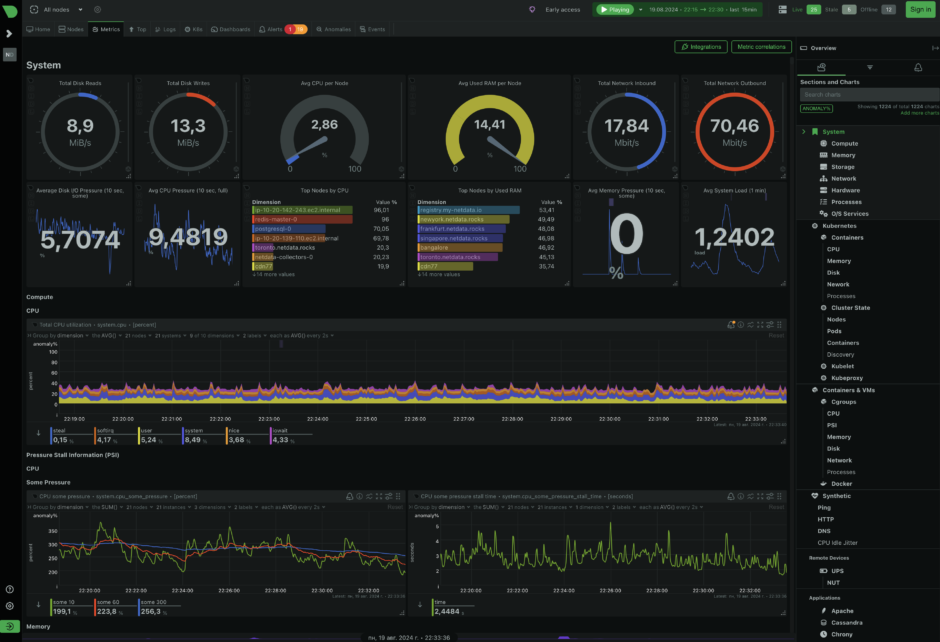
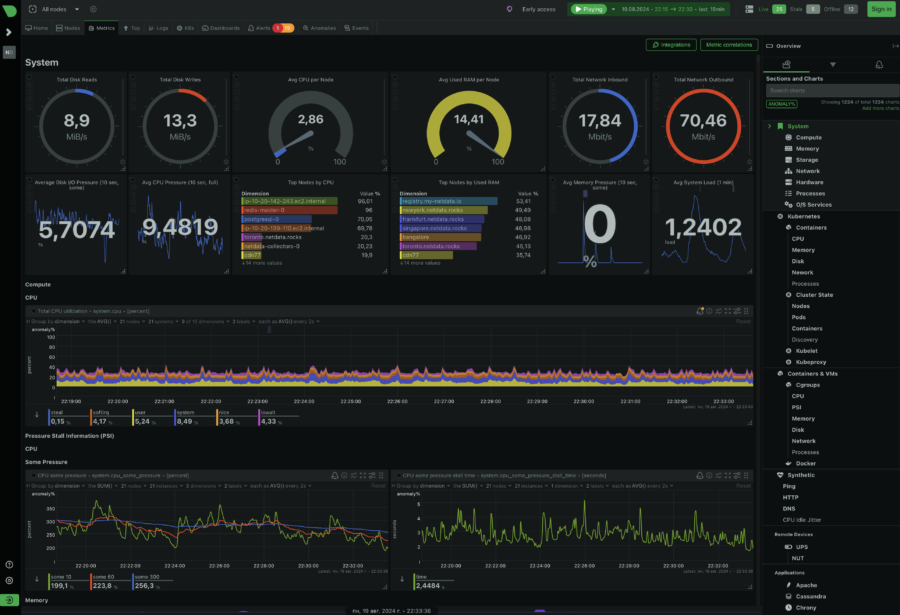
🔥 Fully Automated Powerful Visualization
Using the NIDL (Nodes, Instances, Dimensions & Labels) data model, the Netdata Agent enables the creation of fully automated dashboards, providing corellated visualization of all metrics, allowing you to understand any dataset at first sight, but also to filter, slice and dice the data directly on the dashboards, without the need to learn a query language.
Note: the Netdata UI is closed-source, but free to use with Netdata Agents and Netdata Cloud.
🔔 Out of box Alerts
Comes with hundreds of alerts out of the box to detect common issues and pitfalls, revealing issues that can easily go unnoticed. It supports several notification methods to let you know when your attention is needed.
😎 Low Maintenance
Fully automated in every aspect: automated dashboards, out-of-the-box alerts, auto-detection and auto-discovery of metrics, zero-touch machine-learning, easy scalability and high availability, and CI/CD friendly.
⭐ Open and Extensible
Netdata is a modular platform that can be extended in all possible ways, and it also integrates nicely with other monitoring solutions.
The easiest way to Linux install